Reaction times for simple auditory or visual stimuli are measured. Stimulus exposure endures until a push-button response (space-bar) is given. The inter- stimulus interval is randomly varied from 2.5 to 4 seconds.
For both the dominant and the non-dominant hand 30 stimuli are presented.
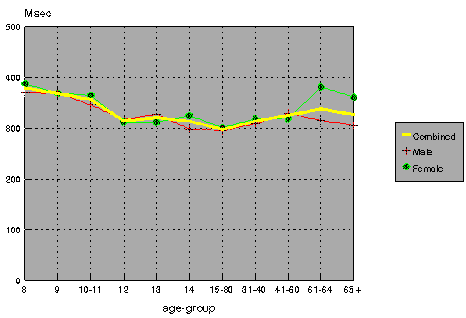
Simple reaction tests give information on alertness functions and speed of activation of the information processing system. This latter process is evaluated in the context of different reaction tests with increasing task complexity. The results show average response latency in milliseconds, the standard deviation and the median (to compensate for a skewed distribution). Reaction times on auditory stimuli are approximately 30 milliseconds faster than on visual stimuli.
The stimulus is a sound of 800 Hz generated by the computer. You have to take care of a sufficient sound level of the speaker. An external speaker can be used.
For uncorrected auditory stimuli (outliers included), an average value of 230 milliseconds is found for the dominant hand in normal subjects with an age around 25. For a comparable epilepsy group 275 milliseconds is the mean reaction time.
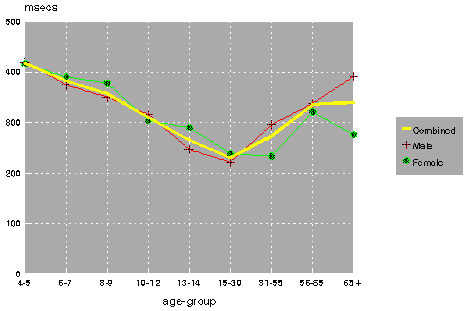
Auditory reaction times of the dominant hand. Control group (N=206)
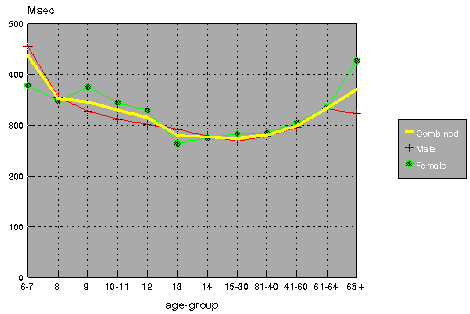
Auditory reaction times of the dominant hand. Epilepsy group (N=1084)
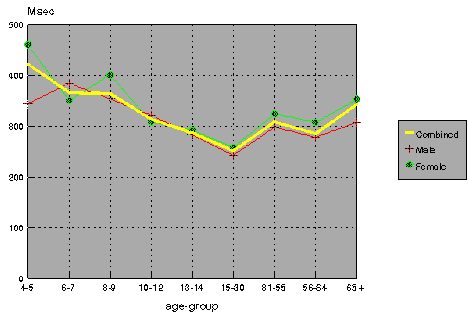
Visual reaction times of the dominant hand. Control group (N=176)
Visual reaction times of the dominant hand. Control group (N=1047)
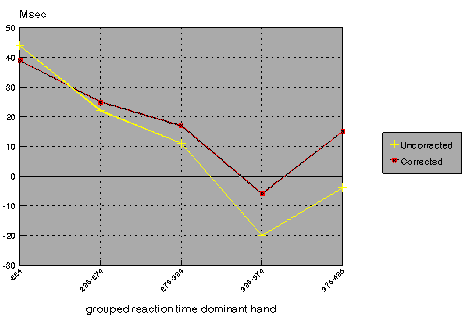
The difference between visual and auditory reaction times is in optimal condition about 50 msecs. If auditory reaction reaction times are slower, the difference decreases. This could be due to an artefact, not always optimal sound levels for instance.
Difference between visual and auditory reaction times. Control group (N=153)
Difference between visual and auditory reaction times. Epilepsy group (N=919)